Metro Vancouver sees fewer home sales and more listings in July
Home buyer activity returned to more typical summer levels in Metro Vancouver last month.
The Real Estate Board of Greater Vancouver (REBGV) reports that residential property sales in the region totalled 2,960 in July 2017, an 8.2 per cent decrease from the 3,226 sales recorded in July 2016, and a decrease of 24 per cent compared to June 2017 when 3,893 homes sold.
Last month’s sales were 0.7 per cent above the 10-year July sales average.
“Housing demand is inconsistent across the region right now. Pockets of the market are still receiving multiple offers and others are not. It depends on price, property type, and location,” Jill Oudil, REBGV president said. “For example, it’s taking twice as long, on average, for a detached home to sell compared to both townhomes and condominiums.”

There were 5,256 detached, attached and apartment properties newly listed for sale on the Multiple Listing Service® (MLS®) in Metro Vancouver in July 2017. This represents a 0.3 per cent increase compared to the 5,241 homes listed in July 2016 and an 8.1 per cent decrease compared to June 2017 when 5,721 homes were listed.
The total number of properties currently listed for sale on the MLS® system in Metro Vancouver is 9,194, a 10.1 per cent increase compared to July 2016 (8,351) and an eight per cent increase compared to June 2017 (8,515).
“Because home sale activity decreased to more historically normal levels in July, the selection of homes for sale in the region was able to edge above 9,000 for the first time this year,” Oudil, said.

For all property types, the sales-to-active listings ratio for July 2017 is 32.2 per cent. By property type, the ratio is 16.9 per cent for detached homes, 44.9 per cent for townhomes, and 62 per cent for condominiums.
Generally, analysts say that downward pressure on home prices occurs when the ratio dips below the 12 per cent mark for a sustained period, while home prices often experience upward pressure when it surpasses 20 per cent over several months.
The MLS® Home Price Index composite benchmark price for all residential properties in Metro Vancouver is currently $1,019,400. This represents an 8.7 per cent increase over July 2016 and a 2.1 per cent increase compared to June 2017.

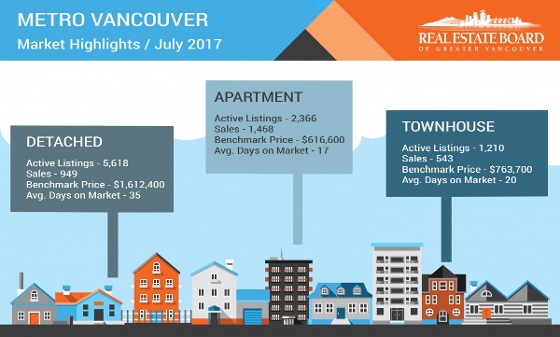
Sales of detached properties in July 2017 reached 949, a decrease of 11.9 per cent from the 1,077 detached sales recorded in July 2016. The benchmark price for detached properties is $1,612,400. This represents a 1.9 per cent increase from July 2016 and a 1.5 per cent increase compared to June 2017.
Sales of apartment properties reached 1,468 in July 2017, a decrease of 8.4 per cent compared to the 1,602 sales in July 2016. The benchmark price of an apartment property is $616,600. This represents an 18.5 per cent increase from July 2016 and a 2.7 per cent increase compared to June 2017.

Attached property sales in July 2017 totalled 543, a decrease of 0.7 per cent compared to the 547 sales in July 2016. The benchmark price of an attached unit is $763,700. This represents an 11.9 per cent increase from July 2016 and a 2.4 per cent increase compared to June 2017.
