RSS

Monthly Statistical Reports - December 2017


Steady sales and diminished listings characterize 2017 for the Metro Vancouver housing market.


After reaching record levels in 2015 and 2016, Metro Vancouver home sales returned to more historically normal levels in 2017. Home listings, on the other hand, came in several thousand units below typical activity.


The Real Estate Board of Greater Vancouver (REBGV) reports that sales of detached, attached and apartment properties reached 35,993 on the Multiple Listing Service® (MLS®) in 2017, a 9.9 per cent decrease from the 39,943 sales recorded in 2016, and a 15 per cent decrease over the 42,326 residential sales in 2015.

Last year’s sales total was, however, 9.7 per cent above the 10-year sales average.


“It was a steady year for home sales across the region, led by condominium and townhome activity, and a quieter year for home listings,” Jill Oudil, REBGV president said. “Metro Vancouver home sales were the third highest we’ve seen in the past ten years while the home listings total was the second lowest on record for the same period.”


Home listings in Metro Vancouver reached 54,655 in 2017. This is a 5.1 per cent decrease compared to the 57,596 homes listed in 2016 and a 4.5 per cent decrease compared to the 57,249 homes listed in 2015.

Last year’s listings total was 4.4 per cent below the 10-year listings average.


“Market activity differed considerably this year based on property type,” Oudil said. “Competition was intense in the condominium and townhome markets, with multiple offer situations becoming commonplace. The detached home market operated in a more balanced state, giving home buyers more selection to choose from and more time to make decisions.”


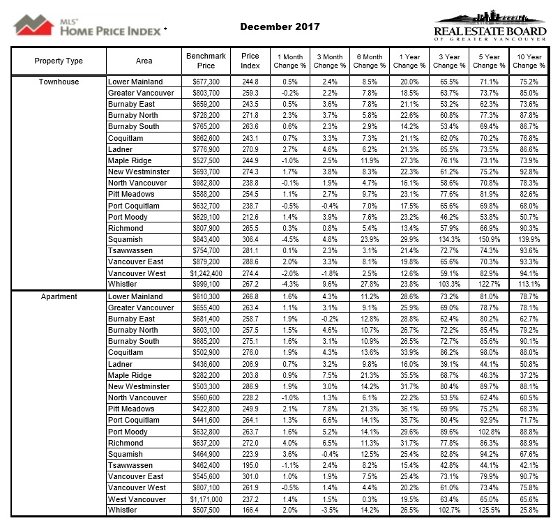
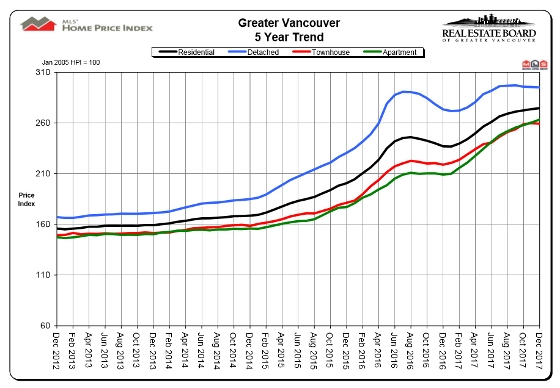
The MLS® HPI composite benchmark price for all residential properties in Metro Vancouver ends the year at $1,050,300. This is up 15.9 per cent compared to December 2016.


The benchmark price of condominiums increased 25.9 per cent in the region last year. Townhomes increased 18.5 per cent and detached homes increased 7.9 per cent.


“Strong economic growth, low interest rates, declining unemployment, increasing wages and a growing population all helped boost home buyer demand in our region last year,” Oudil said.


December summary

Sales of detached, attached, and apartment properties totalled 2,016 in the region in December 2017, a 17.6 per cent increase from the 1,714 sales recorded in December 2016 and a 27.9 per cent decrease compared to November 2017 when 2,795 homes sold.


Last month’s sales were 7.5 per cent above the 10-year sales average for the month.


“As we move into 2018, REALTORS® are working with their clients to help them understand how changing interest rates and the federal government’s new mortgage qualifications could affect their purchasing power,” Oudil said. “Only time will tell what impact these rules will have on the market.


“Home buyers today should get pre-approved before making an offer to ensure that your home buying goals align with your financial situation,” Oudil said.


There were 1,891 residential homes newly listed for sale in December 2017. This represents a 44.1 per cent increase compared to the 1,312 homes listed in December 2016 and a 54 per cent decrease compared to November 2017 when 4,109 properties were listed.


The total number of homes currently listed for sale on the MLS® in Metro Vancouver is 6,958, a 9.7 per cent increase compared to December 2016 (6,345) and a 20.5 per cent decrease compared to November 2017 (8,747).


The sales-to-active listings ratio for December 2017 is 29 per cent. By property type, the ratio is 14.4 per cent for detached homes, 38.8 per cent for townhomes, and 59.6 per cent for condominiums.


Generally, analysts say that downward pressure on home prices occurs when the ratio dips below the 12 per cent mark for a sustained period, while home prices often experience upward pressure when it surpasses 20 per cent over several months.


Sales of detached properties in December 2017 reached 617, a 14 per cent increase from the 541 detached sales recorded in December 2016. The benchmark price for a detached home in the region is $1,605,800. This represents a 7.9 per cent increase compared to December 2016.


Sales of apartment homes reached 1,028 in December 2017, a 12.3 per cent increase compared to the 915 sales in December 2016.The benchmark price of an apartment in the region is $655,400. This represents a 25.9 per cent increase compared to December 2016.


Attached (or townhome) property sales in December 2017 totalled 371, a 43.8 per cent increase compared to the 258 sales in December 2016. The benchmark price of an attached home in the region is $803,700. This represents an 18.5 per cent increase compared to December 2016.


Click here to download the December 2017 stats package

Read


OCTOBER SALES EXCEED HISTORICAL AVERAGE!


The Real Estate Board of Greater Vancouver (REBGV) reports that residential property sales in the region totalled 3,022 in October 2017, a 35.3 per cent increase from the 2,233 sales recorded in October 2016, and an increase of 7.1 per cent compared to September 2017 when 2,821 homes sold.


Last month’s sales were 15 per cent above the 10-year October sales average.

"Conditions continue to vary significantly based on property type. The detached home market is well supplied with homes for sale, which is relieving pressure on prices," Jill Oudil, REBGV president said. "It remains a much different story in the townhouse and apartment markets. Buyers of these properties continue to have limited supply to choose from and are seeing upward pressure on prices."


There were 4,539 detached, attached and apartment properties newly listed for sale on the Multiple Listing Service® (MLS®) in Metro Vancouver in October 2017. This represents a 14 per cent increase compared to the 3,981 homes listed in October 2016 and a 15.6 per cent decrease compared to September 2017 when 5,375 homes were listed.


Monthly Statistical Reports - October 2017


The total number of properties currently listed for sale on the MLS® system in Metro Vancouver is 9,137, a 0.1 per cent decrease compared to October 2016 (9,143) and a 3.5 per cent decrease compared to September 2017 (9,466).


For all property types, the sales-to-active listings ratio for October 2017 is 33.1 per cent. By property type, the ratio is 16.8 per cent for detached homes, 44.8 per cent for townhomes, and 66 per cent for condominiums.

Generally, analysts say that downward pressure on home prices occurs when the ratio dips below the 12 per cent mark for a sustained period, while home prices often experience upward pressure when it surpasses 20 per cent over several months.


"The growth in our provincial economy and job market is contributing to today's demand," Oudil said. "The federal government's announcement of plans to tighten mortgage requirements for the seventh time in the last eight years also helped spur activity in the short term. Many buyers are trying to enter the market before the changes are in place."


Price Trend


The MLS® Home Price Index composite benchmark price for all residential properties in Metro Vancouver is currently $1,042,300. This represents a 12.4 per cent increase over October 2016 and a 0.5 per cent increase compared to September 2017.


Sales of detached properties in October 2017 reached 940, a 44.2 per cent increase from the 652 detached sales recorded in October 2016 and a 34.6 per cent decrease from the 1,437 sales in October 2015. The benchmark price for detached properties is $1,609,600. This represents a four per cent increase from October 2016 and a 0.5 per cent decrease compared to September 2017.


Sales of apartment properties reached 1,532 in October 2017, a 30.1 per cent increase compared to the 1,178 sales in October 2016 and a 0.7 per cent decrease from the 1,543 sales in October 2015. The benchmark price of an apartment property is $642,000. This represents a 22.7 per cent increase from October 2016 and a one per cent increase compared to September 2017.


Attached property sales in October 2017 totalled 550, a 36.5 per cent increase compared to the 403 sales in October 2016 and a 17.4 per cent decrease from the 666 sales in October 2015. The benchmark price of an attached unit is $802,400. This represents a 17.7 per cent increase from October 2016 and a two per cent increase compared to September 2017.


Click here to download the October 2017 stats package

Read

Monthly Statistical Reports - July 2017


Metro Vancouver sees fewer home sales and more listings in July

Home buyer activity returned to more typical summer levels in Metro Vancouver last month.

The Real Estate Board of Greater Vancouver (REBGV) reports that residential property sales in the region totalled 2,960 in July 2017, an 8.2 per cent decrease from the 3,226 sales recorded in July 2016, and a decrease of 24 per cent compared to June 2017 when 3,893 homes sold.

Last month’s sales were 0.7 per cent above the 10-year July sales average.

“Housing demand is inconsistent across the region right now. Pockets of the market are still receiving multiple offers and others are not. It depends on price, property type, and location,” Jill Oudil, REBGV president said. “For example, it’s taking twice as long, on average, for a detached home to sell compared to both townhomes and condominiums.”


There were 5,256 detached, attached and apartment properties newly listed for sale on the Multiple Listing Service® (MLS®) in Metro Vancouver in July 2017. This represents a 0.3 per cent increase compared to the 5,241 homes listed in July 2016 and an 8.1 per cent decrease compared to June 2017 when 5,721 homes were listed.

The total number of properties currently listed for sale on the MLS® system in Metro Vancouver is 9,194, a 10.1 per cent increase compared to July 2016 (8,351) and an eight per cent increase compared to June 2017 (8,515).

“Because home sale activity decreased to more historically normal levels in July, the selection of homes for sale in the region was able to edge above 9,000 for the first time this year,” Oudil, said.


For all property types, the sales-to-active listings ratio for July 2017 is 32.2 per cent. By property type, the ratio is 16.9 per cent for detached homes, 44.9 per cent for townhomes, and 62 per cent for condominiums.

Generally, analysts say that downward pressure on home prices occurs when the ratio dips below the 12 per cent mark for a sustained period, while home prices often experience upward pressure when it surpasses 20 per cent over several months.


The MLS® Home Price Index composite benchmark price for all residential properties in Metro Vancouver is currently $1,019,400. This represents an 8.7 per cent increase over July 2016 and a 2.1 per cent increase compared to June 2017.


Sales of detached properties in July 2017 reached 949, a decrease of 11.9 per cent from the 1,077 detached sales recorded in July 2016. The benchmark price for detached properties is $1,612,400. This represents a 1.9 per cent increase from July 2016 and a 1.5 per cent increase compared to June 2017.


Sales of apartment properties reached 1,468 in July 2017, a decrease of 8.4 per cent compared to the 1,602 sales in July 2016. The benchmark price of an apartment property is $616,600. This represents an 18.5 per cent increase from July 2016 and a 2.7 per cent increase compared to June 2017.


Attached property sales in July 2017 totalled 543, a decrease of 0.7 per cent compared to the 547 sales in July 2016. The benchmark price of an attached unit is $763,700. This represents an 11.9 per cent increase from July 2016 and a 2.4 per cent increase compared to June 2017.


Click here to download the July 2017 stats package

Read
Categories:   Abbotsford West, Abbotsford Real Estate | Bear Creek Green Timbers, Surrey Real Estate | ben | Ben D'Ovidio | Brentwood Park, Burnaby North Real Estate | Burnaby Hospital, Burnaby South Real Estate | Burnaby Presale | burnaby realtor | Buying A Home | buying first property | Cambie, Vancouver West Real Estate | Canyon Heights NV, North Vancouver Real Estate | Canyon Springs, Coquitlam Real Estate | Capitol Hill BN, Burnaby North Real Estate | Cariboo, Burnaby North Real Estate | Central BN, Burnaby North Real Estate | Central Coquitlam, Coquitlam Real Estate | Central Lonsdale, North Vancouver Real Estate | Central Park BS, Burnaby South Real Estate | Central Pt Coquitlam, Port Coquitlam Real Estate | Chilliwack E Young-Yale, Chilliwack Real Estate | Chilliwack N Yale-Well, Chilliwack Real Estate | Chilliwack Proper East, Chilliwack Real Estate | Chilliwack Proper West, Chilliwack Real Estate | Citadel PQ, Port Coquitlam Real Estate | Clayton, Cloverdale Real Estate | Cliff Drive, Tsawwassen Real Estate | Collingwood VE, Vancouver East Real Estate | Condo Presale | Coquitlam East, Coquitlam Real Estate | Coquitlam West, Coquitlam Real Estate | Downtown NW, New Westminster Real Estate | Downtown VW, Vancouver West Real Estate | East Newton, Surrey Real Estate | Edmonds BE, Burnaby East Real Estate | Fairview VW, Vancouver West Real Estate | False Creek, Vancouver West Real Estate | finanacing,mortgage | first time buyers | Fleetwood Tynehead, Surrey Real Estate | Fraser VE, Vancouver East Real Estate | Fraserview NW, New Westminster Real Estate | GlenBrooke North, New Westminster Real Estate | Glenwood PQ, Port Coquitlam Real Estate | Government Road, Burnaby North Real Estate | Grandview Woodland, Vancouver East Real Estate | Harbour Chines, Coquitlam Real Estate | Highgate, Burnaby South Real Estate | King George Corridor, South Surrey White Rock Real Estate | Kitsilano, Vancouver West Real Estate | Langley City, Langley Real Estate | Lions Bay, West Vancouver Real Estate | Lynn Valley, North Vancouver Real Estate | Lynnmour, North Vancouver Real Estate | MacKenzie Heights, Vancouver West Real Estate | Metrotown, Burnaby South Real Estate | Mission BC, Mission Real Estate | Montecito, Burnaby North Real Estate | Monthly Statistical Reports | mortgage | mortgage pre-approval | Mount Pleasant VE, Vancouver East Real Estate | Mount Pleasant VW, Vancouver West Real Estate | Nordel, N. Delta Real Estate | North Coquitlam, Coquitlam Real Estate | Oaklands, Burnaby South Real Estate | Parkcrest, Burnaby North Real Estate | Pemberton NV, North Vancouver Real Estate | Quay, New Westminster Real Estate | Queen Mary Park Surrey, Surrey Real Estate | Queensborough, New Westminster Real Estate | Real Estate in Vancouver | Real Estate Statistics | Renfrew Heights, Vancouver East Real Estate | Renfrew VE, Vancouver East Real Estate | reports | Riverwood, Port Coquitlam Real Estate | Royal Heights, North Surrey Real Estate | Sapperton, New Westminster Real Estate | Scottsdale, N. Delta Real Estate | selling a condo | Simon Fraser Hills, Burnaby North Real Estate | Simon Fraser Univer., Burnaby North Real Estate | South Meadows, Pitt Meadows Real Estate | South Slope, Burnaby South Real Estate | South Vancouver, Vancouver East Real Estate | Sperling-Duthie, Burnaby North Real Estate | Strathcona, Vancouver East Real Estate | Sun Towers Condo Presale | Sunshine Hills Woods, N. Delta Real Estate | University VW, Vancouver West Real Estate | Uptown NW, New Westminster Real Estate | vancouver | Vancouver Heights, Burnaby North Real Estate | Vancouver Real Estate, Statistics, Real Estate Reports | vancouver realtor | Victoria VE, Vancouver East Real Estate | Walnut Grove, Langley Real Estate | West Central, Maple Ridge Real Estate | West End VW, Vancouver West Real Estate | Westridge BN, Burnaby North Real Estate | Whalley, North Surrey Real Estate | Willingdon Heights, Burnaby North Real Estate | Willoughby Heights, Langley Real Estate | Yaletown, Vancouver West Real Estate
Reciprocity Logo The data relating to real estate on this website comes in part from the MLS® Reciprocity program of either the Greater Vancouver REALTORS® (GVR), the Fraser Valley Real Estate Board (FVREB) or the Chilliwack and District Real Estate Board (CADREB). Real estate listings held by participating real estate firms are marked with the MLS® logo and detailed information about the listing includes the name of the listing agent. This representation is based in whole or part on data generated by either the GVR, the FVREB or the CADREB which assumes no responsibility for its accuracy. The materials contained on this page may not be reproduced without the express written consent of either the GVR, the FVREB or the CADREB.